
A voltage estimate is one part of a measurement chain.
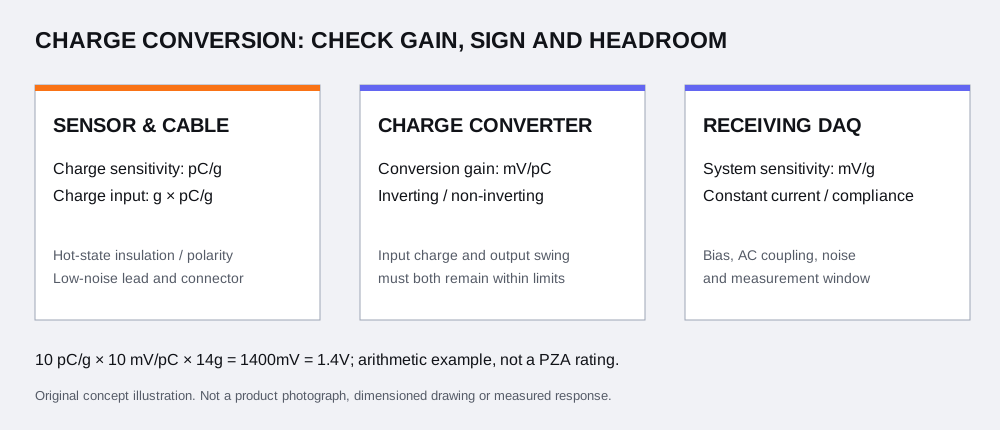
- Charge sensitivity and converter gain have different units; their product is the nominal system sensitivity.
- Reducing gain reduces voltage. It does not change the charge produced by the sensor at the entered peak.
- A missing instrument limit prevents a combined electrical ceiling. Do not treat a blank field as unlimited capacity.
- These calculations use your nominal values. The sensor linear range and application suitability remain outside this worksheet.
Keep sensor sensitivity and conversion gain distinct.
| Quantity | Unit | Meaning here |
|---|---|---|
| Sensor charge sensitivity S | pC/g | Charge produced per acceleration g under the stated calibration condition. |
| Forward conversion K | mV/pC | Voltage magnitude per input charge. |
| Inverse conversion C | pC/mV | Reciprocal of K, not the same numerical value. |
| Acceleration a | g peak | Peak magnitude from the intended test waveform. |
| Electrical limits | pC peak / V peak | Positive capacity entries for the exact setting and interface. |
For a hypothetical K = 4 mV/pC, the reciprocal is C = 0.25 pC/mV. With S = 6 pC/g, either convention gives 24 mV/g. The unit selector performs the reciprocal conversion when the current gain entry is valid.
| Output | Equation | Check |
|---|---|---|
| Forward gain from inverse gain | K = 1 / C | (pC/mV)⁻¹ = mV/pC |
| System sensitivity | S × K | (pC/g) × (mV/pC) = mV/g |
| Peak charge Q | S × a | (pC/g) × g = pC |
| Unclipped peak voltage V | S × a × K / 1000 | mV / 1000 = V |
| Entered electrical ceiling | min(Qlimit / S, Vamplimit × 1000 / (S × K), VDAQlimit × 1000 / (S × K)) | Shown only when all three electrical capacities are entered; rounded output is not an operating setpoint. |
Display uses up to eight significant digits; limit classification uses unrounded arithmetic. A tiny floating-point comparison allowance is not a sensor tolerance, accuracy statement or engineering reserve. The scaling relationship is documented in the original PCB converter manual, printed page 4 ↗.
Three examples that separate the limiting stages.
| Example | S / peak / K | Charge / V | Entered limits: Q / amp / DAQ | Interpretation |
|---|---|---|---|---|
| A: all three capacities entered | 8 pC/g / 20g / 5 mV/pC | 160 pC / 0.8 V | 200 pC / 2 V / 1 V | Below these entries; electrical ceiling 25g. Sensor range unverified. |
| B: input charge dominates | 8 pC/g / 20g / 1 mV/pC | 160 pC / 0.16 V | 100 pC / 2 V / 1 V | Input charge exceeds 100 pC even at the lower gain. |
| C: receiving DAQ dominates | 8 pC/g / 20g / 10 mV/pC | 160 pC / 1.6 V | 200 pC / 2 V / 1 V | DAQ entry is exceeded; the amplifier voltage entry is not. |
Example A
Example B
Example C
Check charge, amplifier swing and receiving headroom separately.
| Stage | Comparison | What changing gain does |
|---|---|---|
| Converter charge input | S × a against the entered pC capacity | Does not change sensor charge. A changed instrument setting needs its own documented capacity. |
| Amplifier AC output | Unclipped V against usable AC output excursion | Lower gain lowers the nominal output voltage. |
| DAQ AC input | Unclipped V against headroom at its operating bias | Lower gain lowers this voltage but changes the sensitivity seen by the DAQ. |
“At limit” means no nominal reserve. “Below” describes the entries only. Neither includes sensitivity tolerance or unexpected transients. If a stage is exceeded, the displayed voltage remains the hypothetical linear prediction; it is not a saturation or recovery simulation.
An actual converter manual lists input range, output excursion and polarity separately. Use the exact suffix and setting rather than copying limits from another gain: PCB 422E12 original manual ↗.
Use available AC excursion, not a supply or full-span voltage.
For a purely illustrative DC-coupled input window of 0–10 V with an 8 V bias, the smaller distance to either rail is min(8−0, 10−8) = 2 V. That is the symmetric AC peak excursion in this simplified window. A full-span value of 10 V would give a different and misleading comparison. Actual coupling, bias drift, overrange behavior and load require the receiving instrument data.
The original converter manual, printed page 3 ↗ describes an AC signal with a DC bias and subsequent coupling. The calculator does not infer an available swing from a supply or model name.
Amplitude arithmetic does not establish frequency response.
PCB’s charge-mode technical note ↗ discusses charge scaling and the conditioner’s role in low-frequency behavior. It also distinguishes mechanical resonance from usable response. Here there is no filter, time-constant or mounted-resonance model; state flatness, pulse duration and mounting independently.
A raw charge sensor connected to a voltage input is a different circuit. Endevco’s direct-voltage explanation ↗ includes sensor/external capacitance and receiving input resistance. Do not substitute that path for the charge-amplifier gain equation. For DC or long-duration requirements, review the bridge-sensor path.
Keep a separate review for the hot probe and each electrical stage.
Insulation and low-noise cable behavior are separate from nominal gain. The PCB conditioning note ↗ explains why input insulation and charge-cable noise matter. For a high-temperature brief, provide local probe, termination, cable-segment and electronics temperatures. Review the PZA-CHG hot-zone chain with those conditions.
Turn the calculation into a documented configuration request.
| Decision | Evidence to provide | Next step |
|---|---|---|
| Sensor choice | Calibrated pC/g and tolerance, linear range, frequency/pulse, mounting and full original suffix. | Check an original model. |
| Conditioner choice | Gain convention, input charge, swing, source-resistance condition and polarity. | Review conditioning requests. |
| DAQ integration | Excitation current, compliance, bias/coupling, available input excursion, channels and pinout. | Include the exact DAQ reference in the RFQ. |
| Thermal route | Actual local temperatures and hot/cool cable boundaries. | Request a matched cable/termination review. |
| Purchase scope | Quantity, destination, calibration scope, controlled drawing and delivery requirements. | Quote the sensor and chain together. |
Buying only the sensor may leave cable, converter and calibration work unresolved. A complete-chain request makes those cost items visible; it does not establish a price or lead time. All PZA model identifiers remain configuration requests pending supply evidence.
Questions about sensitivity, limits and the RFQ.
How do I convert pC/g into mV/g?
Multiply the charge sensitivity in pC/g by the forward charge-converter gain in mV/pC. For example, 8 pC/g × 5 mV/pC = 40 mV/g. The units cancel; an exact calibrated value and its tolerance still matter.
Are mV/pC and pC/mV the same gain?
They are reciprocal conventions. A value of 10 mV/pC is 0.1 pC/mV. The selector converts a valid current value to its reciprocal to preserve the nominal forward gain.
Can I enter RMS acceleration?
The input is peak magnitude. Obtain the relevant peak from your waveform or test specification; do not assume a sinusoidal conversion for an arbitrary shock or transient. Peak-to-peak values also need a waveform-specific interpretation.
Does g mean the sensor mass?
Here g is acceleration expressed in multiples of standard gravity. It is not sensor mass in grams. The miniature-sensor family separately discusses mass loading.
Why are all hardware limits initially blank?
The example has no nominated or verified hardware. Enter the exact converter input-charge limit, available AC output excursion and receiving DAQ AC headroom. A missing limit stays unknown.
Will a lower gain prevent charge-input overload?
It reduces the predicted voltage, but it does not reduce the sensor charge S × a. The independent input-charge comparison can remain exceeded. A new actual gain setting may also have a different specified input range; enter that documented value separately.
What does at entered limit mean?
The nominal prediction reaches an entered limit with no nominal reserve. This is not a recommended operating point; calibration tolerance, transients and real instrument behavior are not included.
Is the displayed voltage a predicted clipped waveform?
No. It is the unclipped linear prediction. When any limit is exceeded, this tool does not simulate the saturated waveform, recovery time, protection behavior or resulting measurement error.
Can I use the instrument supply voltage as its output limit?
No. Enter the documented usable AC peak excursion at the operating bias and load. Supply, bias, coupling and compliance are separate constraints.
Does a below-limit result approve a high-temperature charge sensor?
No. Probe, cable, termination, insulation at local temperature, mechanical range, frequency response and calibration must be reviewed independently. No PZA model is automatically selected.
Does this tool apply directly to voltage-mode or bridge sensors?
No. It assumes a charge-output sensor followed by charge conditioning. Integral-electronics voltage sensors and piezoresistive bridges need their own excitation and interface checks; use the working-principle guide to choose the path.
What reaches the inquiry email?
Every entered value and gain convention, nominal result, separate limit state, unresolved check and source page is copied into the RFQ test brief. The server recomputes imported inputs; complete the buyer and test context before sending.
Method and source record.
The equations and scenarios are reproducible nominal calculations, reviewed 9 November 2026. Source documents support the electrical distinctions, not PZA hardware capability. Original manuals may describe other suffixes or settings; none is automatically a PZA approval.
Return to your calculation ↑